Architecture

The project consists of three sets of data as shown in the figure. Mapreduce is first used to compute average and summation of data. Later on, GISJOIN is used to map the data to the correct county and finally, Tableau is used for data visualization. The dataset is about 30TB in size and only 30GB is used in this project. The dataset can be found here.

Mapreduce Result Sample

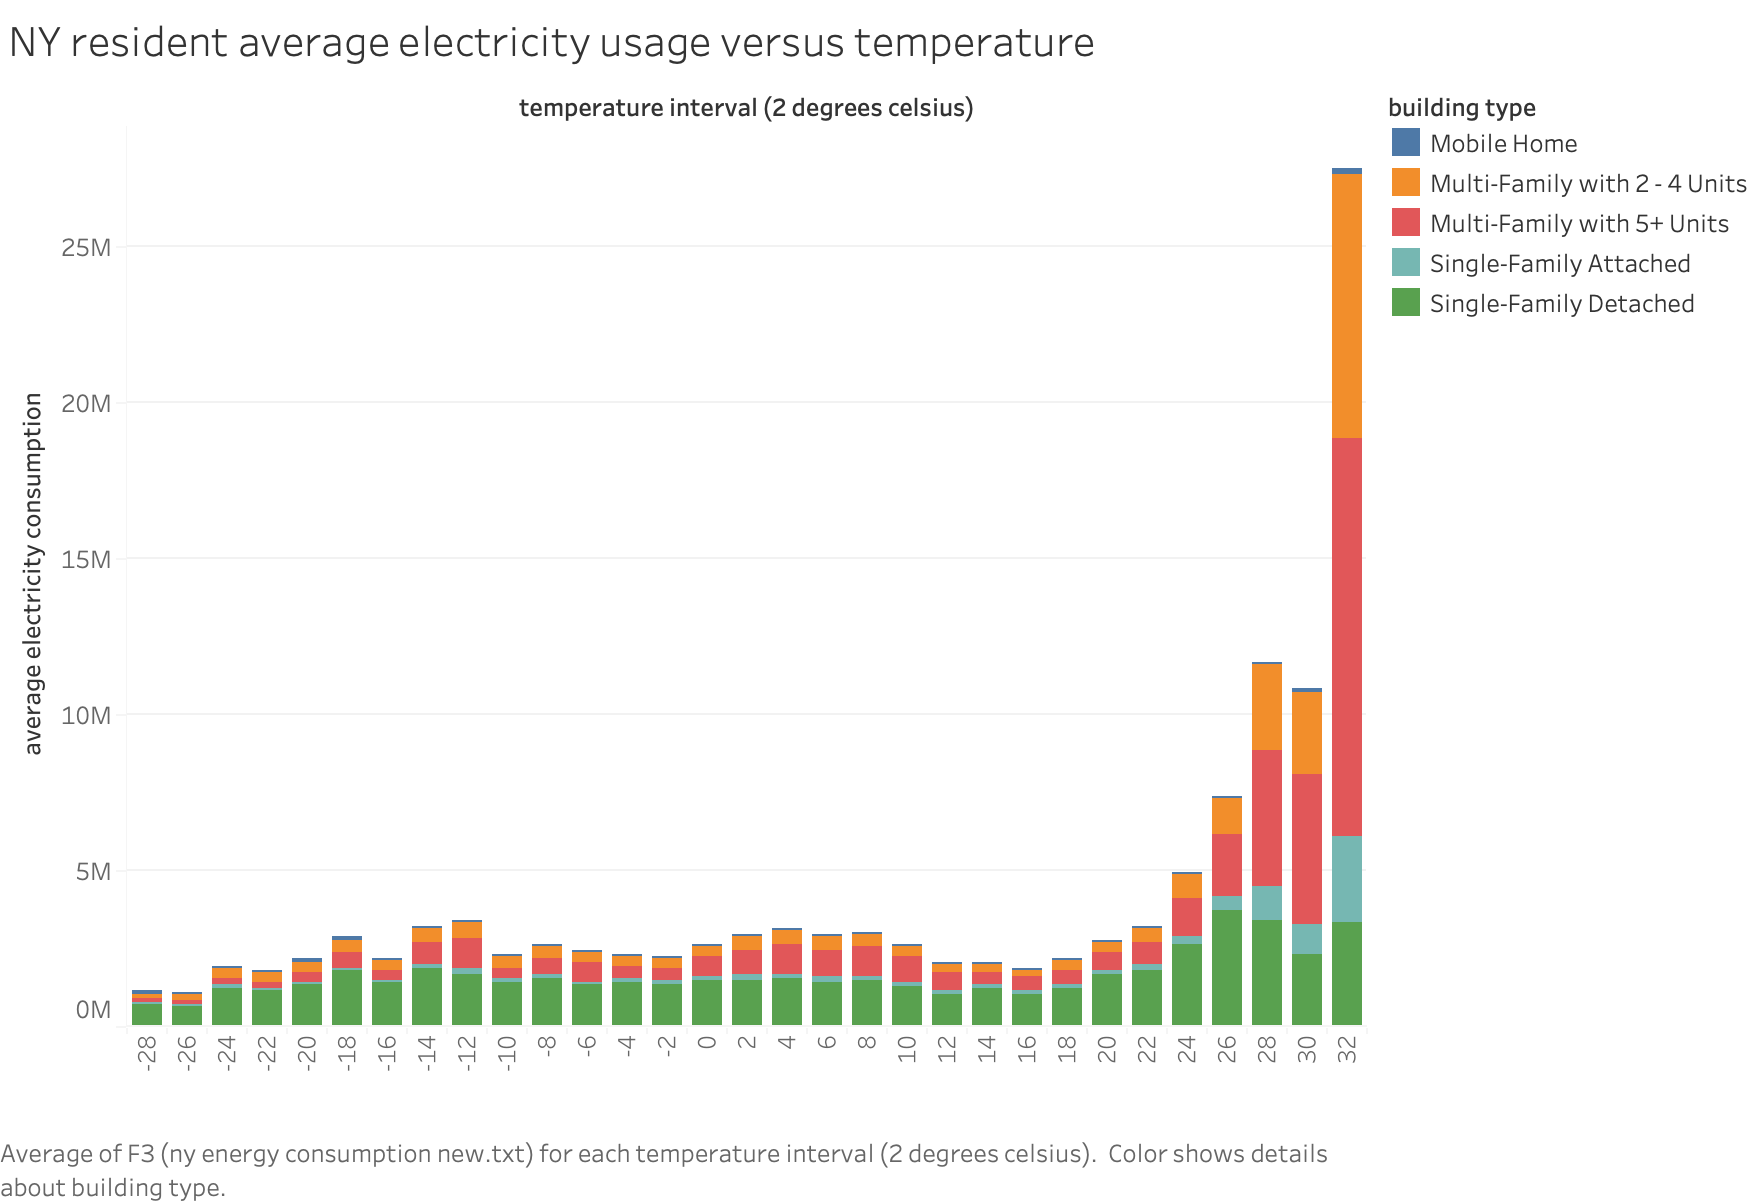
Here is a plot of NY resident average electricity usage vs temperature.

Tableau Result Samples

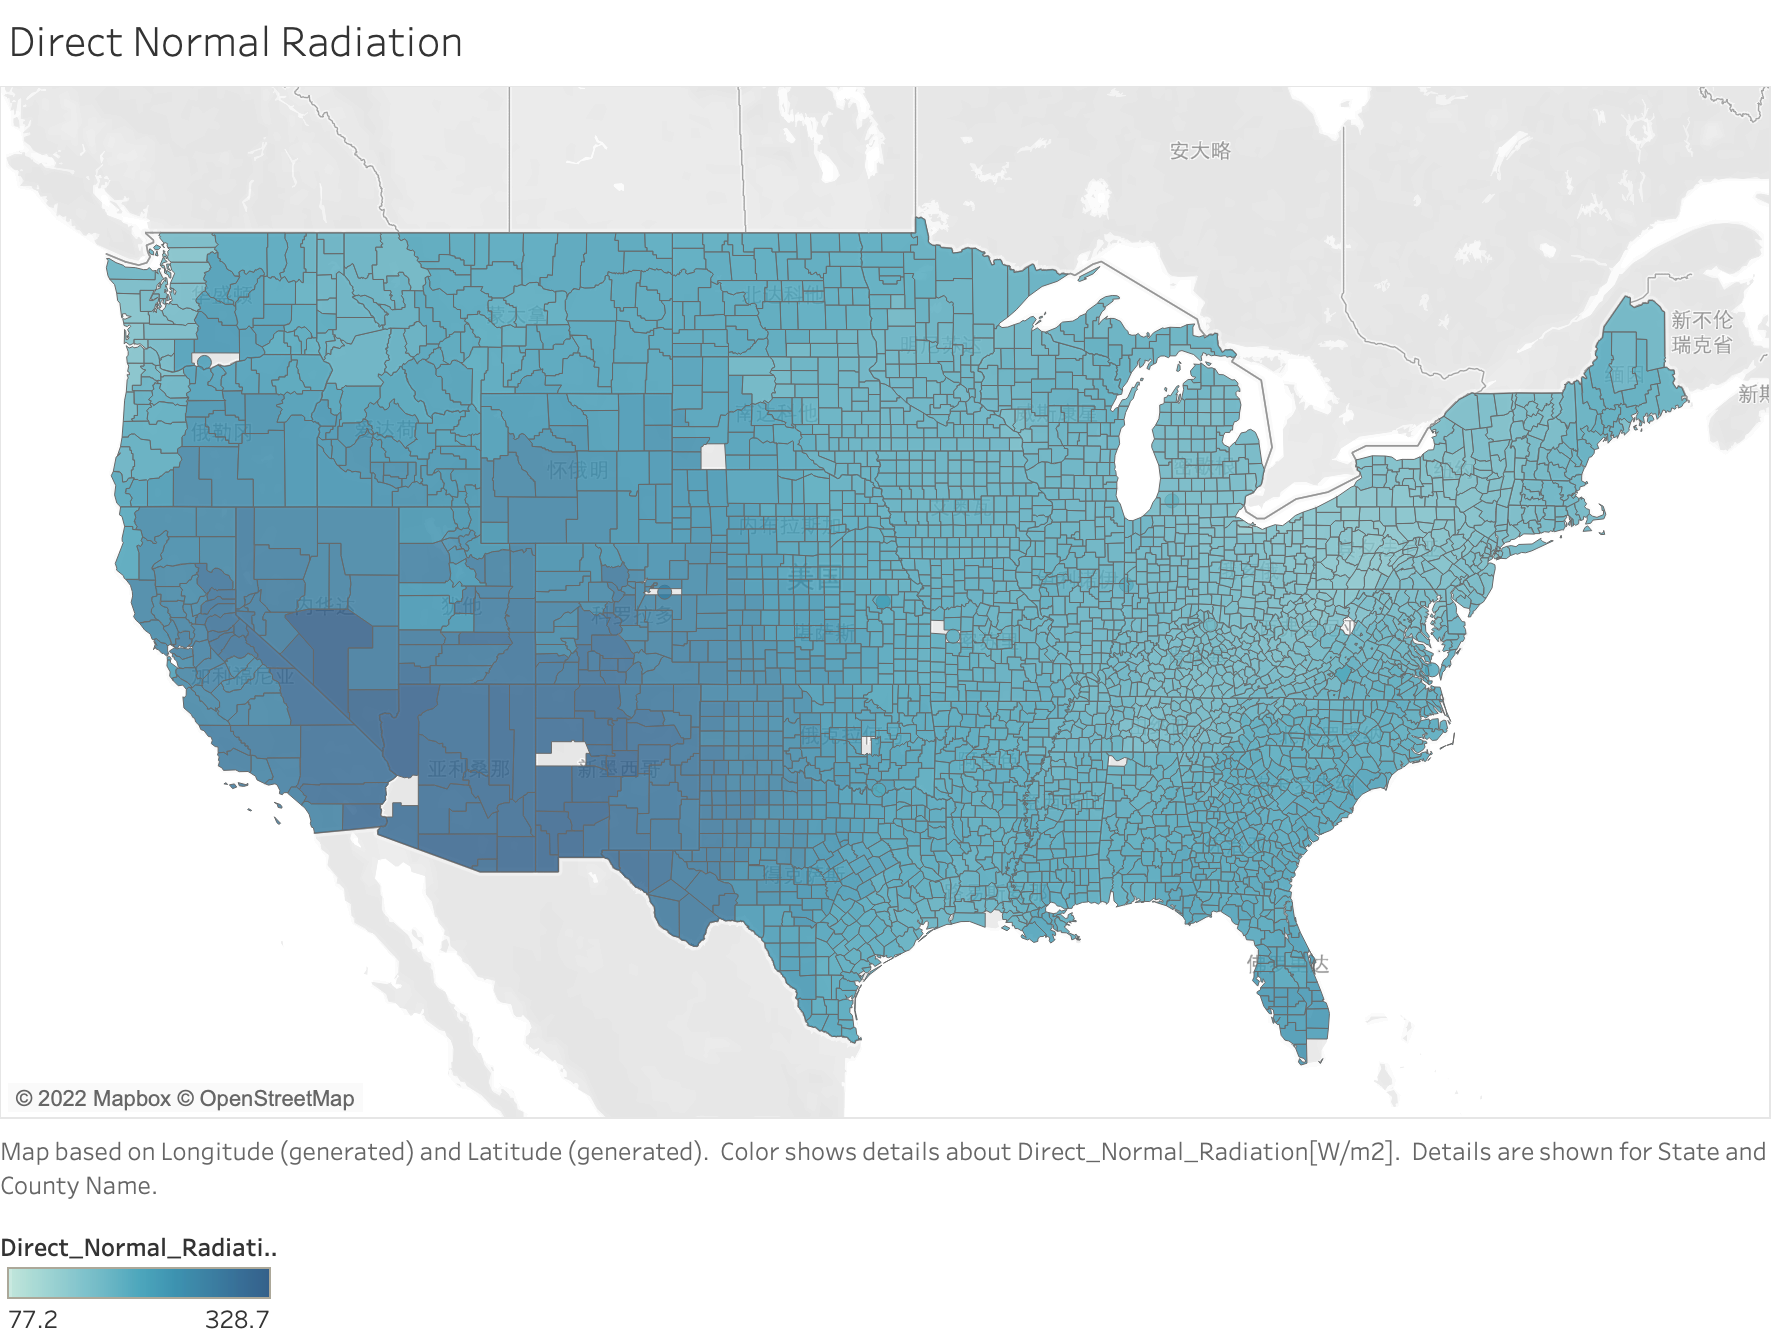
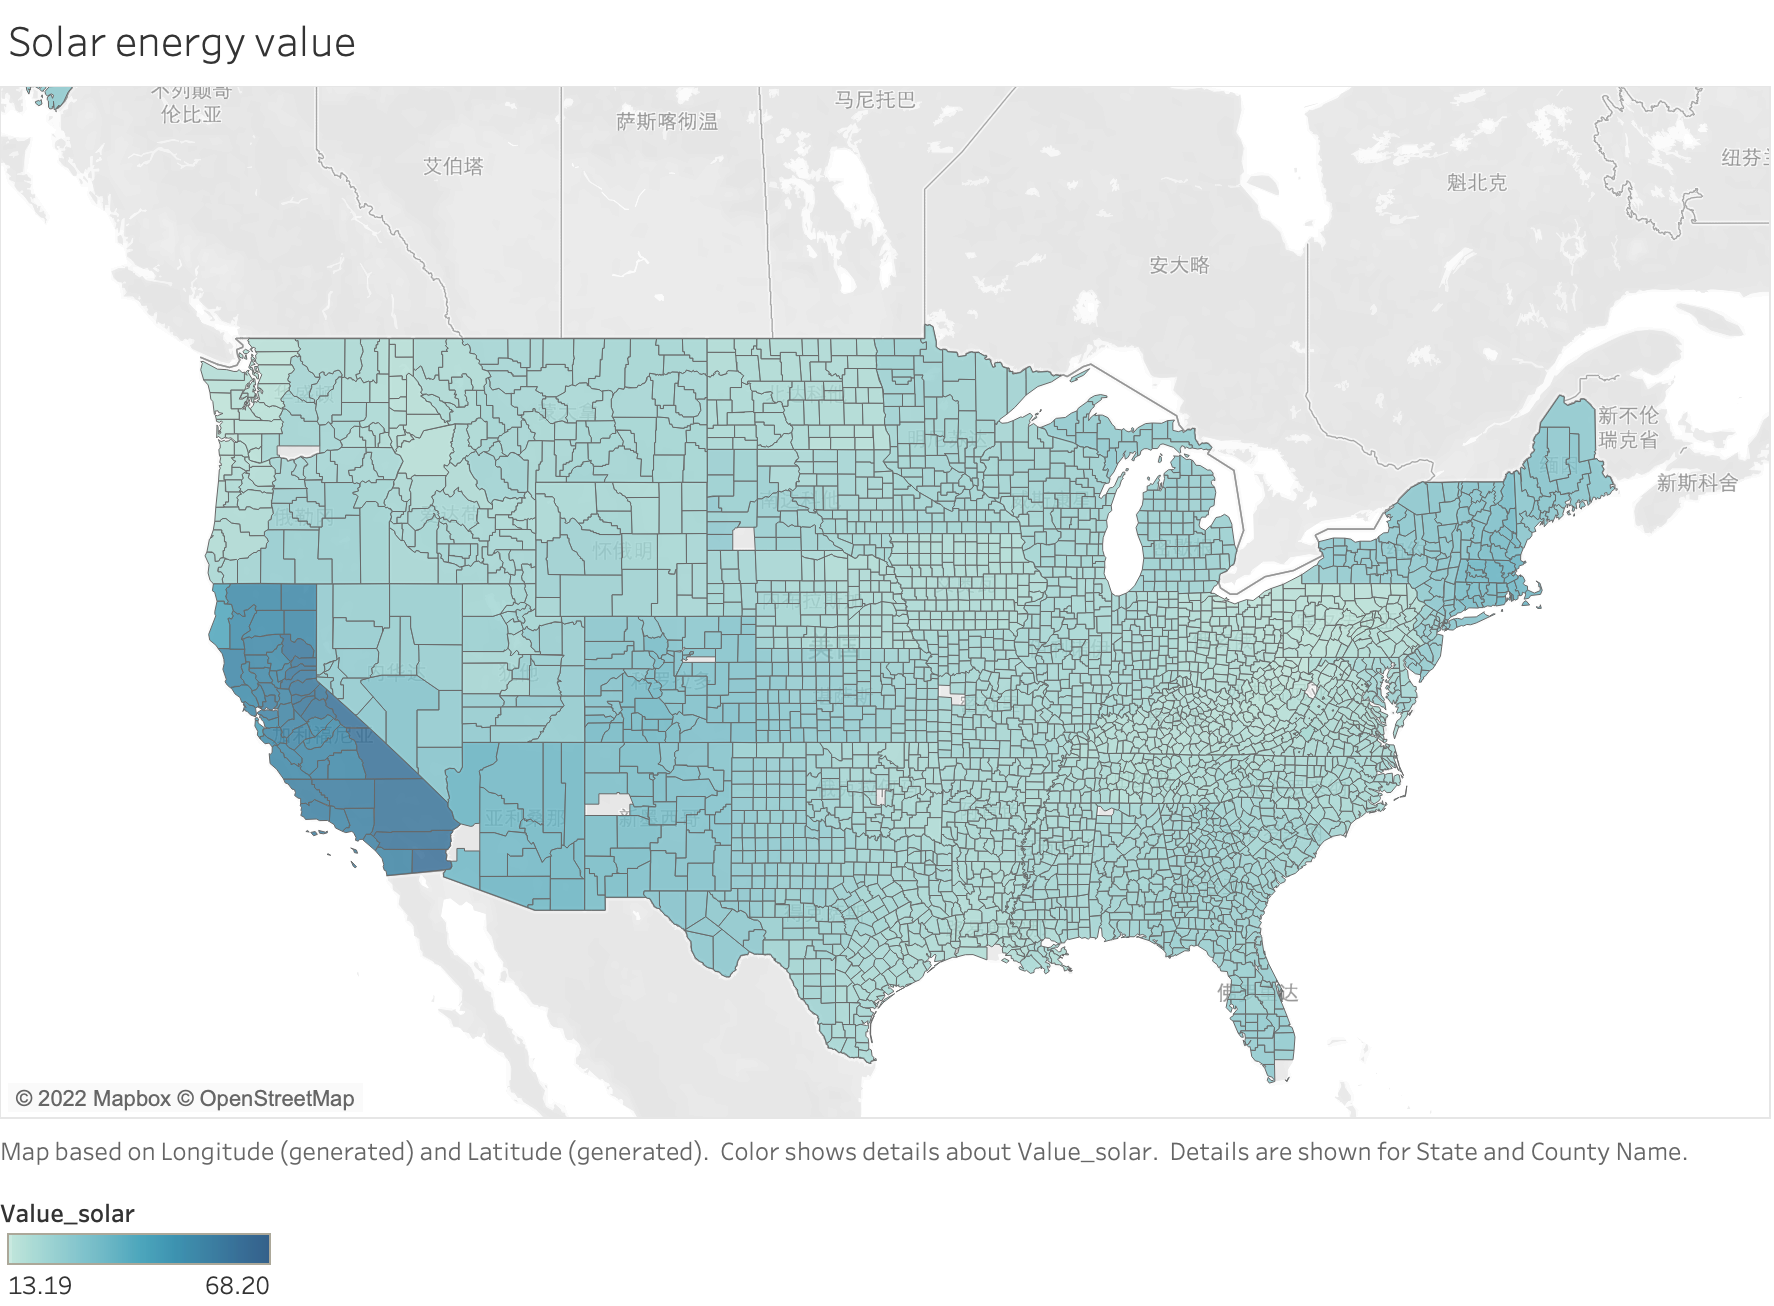
Here are two plots made in Tableau to visualize the solar resource and solar energy potential in the U.S.. The code repositories for this project can be found here and the detailed report can be found here.

Address

Brooklyn, NY 11201
United States of America
Or
Hangzhou, Zhejiang
China